NVIDIA Nemotron Labs Dory 1.0 4B is a text-generation model with about four billion parameters, designed for general-purpose reasoning, including math and code. Dory runs some of its layers more than once, reusing the same weights. With two loops and 1,040 attention positions, each cached decoding step requires about 11.89 billion floating-point operations for matrix projections and attention.
Part I: Dory’s architecture and compute per token
Shared layers and recurrent execution
Dory divides its layers into three groups: input, recurrent, and output. A token’s numerical representation passes through the input layers first. It then passes through the recurrent layers, which can run several times. Each pass uses the same weights to update the representation and receives the input layers’ output. Finally, the output layers process the result before the model predicts the next token. This repetition within a token’s computation is called latent recurrence in the Dory model code.
The checkpoint configuration has eight input, twenty recurrent, and eight output blocks. Each block pairs an attention layer with a multilayer perceptron, or MLP. Attention combines information from different tokens, while the MLP transforms each token’s representation separately. One pass through all three groups executes 36 blocks. With two passes through the recurrent group, the count becomes 8 + 2 × 20 + 8 = 56. The checkpoint still stores only 36 blocks’ weights. Its configuration lists attention and MLP as separate layers, so the layer count there is twice the block count.
The checkpoint contains 3,975,229,440 parameters regardless of how many times the recurrent layers run. More passes add computation without adding weights. They can still add memory use: with the per_loop setting used here, each pass has a separate attention cache. The memory calculation below accounts for those caches.
Dory builds on normalized GPT, or nGPT. The nGPT paper describes scaling learned vectors and hidden representations to unit length. Dory also combines two kinds of attention. Sliding-window attention uses recent tokens, while full attention can use the entire available history. NVIDIA’s architecture summary describes this mixture.
Counting the work for one decode token
An attention layer receives 2,560 values for each token. Its query projection is a matrix multiplication: a matrix with 2,560 input columns and 4,096 output rows transforms those values into 16 query heads, each containing 256 values. At two FLOPs per multiply-add, this projection costs 2 × 2,560 × 4,096 = 20,971,520 FLOPs.
The key and value projections each produce four heads of 256 values, for a total of 1,024 values each. A separate projection produces 4,096 values for the attention gate. The output projection then maps the attention result from 4,096 values back to 2,560. Every attention call runs all five projections: query, key, value, gate, and output.
The MLP has two projections from 2,560 to 7,168 values, one for its gate branch and one for its up branch. A third projection maps the result back from 7,168 to 2,560. Once all the blocks have run, the vocabulary projection converts the final 2,560 values into 131,072 logits, one score for each vocabulary entry. It runs only once. The input embedding is different: it looks up the token’s vector in a weight matrix rather than multiplying by the whole matrix.
The pinned configuration and projection definitions specify these dimensions. They also agree with the tensor shapes recorded in the BF16 checkpoint’s safetensors header. With two loops, the matrix work that does not depend on context length is:
| Matrix operations | FLOPs per call | Calls per decode token |
|---|---|---|
| Attention Q, K, V, gate, and output projections | 73,400,320 | 56 |
| MLP gate, up, and down projections | 110,100,480 | 56 |
| Vocabulary projection | 671,088,640 | 1 |
Multiplying each row’s cost by its call count gives 10,947,133,440 FLOPs, or 10.947 GFLOPs. One GFLOP is one billion floating-point operations. The one-loop baseline costs 7.277 GFLOPs under the same convention. A second pass through the twenty recurrent blocks adds 3.670 GFLOPs, about 50.4% more fixed matrix work. Those blocks reuse their 1,835,008,000 matrix weights. The input blocks, output blocks, and vocabulary head run once in either case, and the total number of stored parameters does not change.
The projections above have the same cost at every history length. Attention over cached keys and values adds a separate cost that grows with the number of tokens available. For this calculation, assume one sequence, one query token, and a separate cache for each recurrent pass. Let L be the number of available positions, including the current token. Full attention uses all L keys. Sliding attention uses at most 1,024. Earlier tokens already have keys and values in the cache, so this step does not repeat their K/V projections.
The query-key product produces attention scores. Softmax converts those scores to weights, and a second matrix product uses the weights to combine the values. Each of these two matrix products costs 2 × 16 × 256 × keys FLOPs per attention call. Grouped-query attention shares four KV heads among sixteen query heads, but all sixteen query heads still perform both products. With two loops, there are fourteen full-attention calls and 42 sliding-attention calls, giving:
Attention FLOPs = 4 × 4,096 × (14 × L + 42 × min(L, 1,024))
Total counted FLOPs = 10,947,133,440 + Attention FLOPs| Attention positions, including the query | Fixed matrix GFLOPs | Cache-attention GFLOPs | Total counted GFLOPs |
|---|---|---|---|
| 1,040 | 10.947 | 0.943 | 11.890 |
| 8,208 | 10.947 | 2.587 | 13.534 |
| 8,209 | 10.947 | 2.588 | 13.535 |
| 262,144 | 10.947 | 60.834 | 71.781 |
The first three rows use the prompt lengths from the benchmarks below. Each row describes the work for one cached query at that history length, excluding the work of processing the prompt. In an actual 128-token completion, prompt processing, or prefill, produces the first output token. The remaining 127 decode steps have history lengths from P + 1 through P + 127, where P is the prompt length. Averaged over those steps, the counted work is 11.905 GFLOPs per step for the short prompts and about 13.549 GFLOPs for the long prompts.
Once the history exceeds 1,024 positions, the sliding-attention cost stops growing because its window is full. Full attention continues to use every position, so its cost grows linearly with history length. Each additional recurrent loop repeats five full-attention and fifteen sliding-attention calls, along with the fixed matrix work above.
These figures count mathematical operations in the model. They are analytical estimates, not profiler measurements or counts of GPU instructions. The count includes matrix projections and attention products, including the gate’s matrix projection. It excludes normalization, rotary embeddings, softmax, SiLU, sigmoid, elementwise gates and scales, residual and loop additions, sampling, cache movement, and kernel padding. The assumptions are BF16 weights and KV, with a batch size of one. For a batch of equally long sequences, multiply the logical work by the batch size. Throughput also depends on kernel fusion, memory traffic, and the hardware instructions used to execute that work.
The calculation bundle contains the Python script, pinned configuration, checkpoint tensor shapes, and JSON results. Extract it and run python3 calculate.py. It needs only the Python standard library and does not load the model. The script checks the compact formula against a separate sum over tensor shapes and layer executions. It also checks the attention count at lengths just below, at, and above the sliding-window limit.
Internal loops and generated reasoning
NVIDIA recommends starting with two loops. It reports that additional loops can improve accuracy and reduce the number of generated tokens. All B70 measurements here use two loops, so they do not test how changing the loop count affects those results.
Dory can also write out reasoning before giving its final answer. NVIDIA’s serving example uses a reasoning parser to separate that text from the answer. This generated reasoning consumes output tokens. The internal loops instead repeat computation within each token. Increasing the loop count adds work within each decoding step. Allowing more output tokens lets generation continue for more steps. The timing runs disable explicit thinking but retain both internal loops. The quality checks cover both thinking-disabled and default-reasoning settings.
Context length and memory
NVIDIA specifies a context length of up to 256K tokens, with an exact limit of 262,144 in the checkpoint configuration. The prompt, conversation history, and generated tokens all count toward that limit. BF16 stores each weight in a 16-bit format, but the weights are only part of the memory requirement. Attention also needs space to cache keys and values from earlier tokens. See the model card’s context and serving guidance.
The B70 tests check that the model runs, measure its memory use, and benchmark serving performance on fixed workloads. The retrieval probe and 100-example quality tests provide limited checks of its answers. They are separate from NVIDIA’s model benchmarks.
Part II: Get one card serving the pinned checkpoint
The first setup used one of the machine’s four B70s, with BF16 weights and the full 256K context. It failed before inference: the vLLM XPU image did not recognize model_type=dory.
NVIDIA’s model card pointed to vLLM PR 60149, where Dory support was still under review. Adding the PR’s Python model code to the official XPU image supplied the missing support. This left the image’s Intel runtime and binary kernels in place. The server could then run the graph, quality, and full-context tests described below.
On one B70, the server processed 262,011 input tokens and correctly returned a code placed halfway through the prompt. The performance benchmarks used shorter requests of repeatable lengths, first on one card and then across four independent replicas.
Build the model extension
The reproduction bundle includes the Dockerfiles, upstream model files, registration script, tests, and measurement scripts. Model weights download separately. The setup requires Linux with a working Intel Xe driver, Docker access to /dev/dri, and a B70 with 32 GB-class memory. Allow about 8 GB of disk space for the checkpoint cache, plus space for the container images.
curl -fLO https://blog.rahul.onl/posts/dory-4b-arc-pro/dory-xpu-repro.zip
unzip dory-xpu-repro.zip -d dory-xpu
cd dory-xpu
docker pull "$(cat base-image.txt)"
docker build --build-arg BASE_IMAGE="$(cat base-image.txt)" -t dory-xpu:local .
bash scripts/serve.sh
python3 scripts/wait_ready.py
The build pins the image digest in base-image.txt. That digest identifies the image tagged latest on October 20, 2026. Pulling latest later may retrieve a different image. The recorded digest and checkpoint revision keep this setup reproducible.
| Component | Version used |
|---|---|
| Official XPU image | vLLM 0.32.0, digest beginning 20509fabe50d |
| PyTorch | 2.14.0+xpu |
| Transformers on the server | 5.19.0 |
| Dory model support | PR revision 55076950b6c155f384d6766d63563c3bc20a0e3f |
| BF16 checkpoint | Revision b366b87f762ea334ba3eb55912031baba1515810 |
| Intel GPU compute runtime | 26.27.39122.11 |
| Host | Xeon 676X, 32 cores / 64 threads, four Arc Pro B70s |
| Kernel | CachyOS 7.2.11-1-cachyos |
The server listens on 127.0.0.1:8000. This request disables explicit thinking to check that it can return a short answer:
curl http://127.0.0.1:8000/v1/chat/completions \
  -H 'Content-Type: application/json' \
  -d '{"model":"dory","messages":[{"role":"user","content":"What is 7 times 8?"}],"temperature":0,"max_tokens":256,"chat_template_kwargs":{"enable_thinking":false}}'
For the checkpoint’s default reasoning mode, omit chat_template_kwargs and raise max_tokens to 8,192. That allowance covers the reasoning text as well as the final answer. Following NVIDIA’s example, the server uses the nemotron_v3 parser to separate them. Each timing or quality test below specifies which mode it uses.
Worker imports and the patched package
The extension adds DoryConfig, DoryForCausalLM, and their registry entries. It does not replace PyTorch, rebuild vLLM’s native libraries, or change an attention kernel. The vendored files retain their upstream license and hashes.
Adding the model files exposed a second problem. The base image has both an installed vLLM package and a source checkout at /workspace/vllm. Python workers launched from that directory could import the unpatched checkout instead of the installed package. Setting the derived image’s working directory to /opt/dory-xpu made the workers import the patched package.
A successful import in one shell does not guarantee that a worker imports the same package. If a worker still reports an unknown architecture, check the import path from its working directory before changing the model code.
The image passed all 43 vendored upstream tests for model math, cache behavior, and weight loading. These tests run on the CPU. On all four cards, separate checks passed for BF16 matrix multiplication and XPU graph replay. The model server also passed HTTP generation, concurrent-request, and streaming checks.
Part III: Memory use and graph execution
Count the caches created by two recurrent loops
The same block counts determine how many attention caches the server needs. In the model card’s notation, Dory has eight input blocks, twenty recurrent blocks, and eight output blocks. Two loops execute 8 + 2 × 20 + 8 = 56 attention/MLP pairs using weights for 36 pairs. Because the configuration lists attention and MLP separately, num_hidden_layers is 72.
The server uses NVIDIA’s suggested two loops with recurrent_kv_cache_mode=per_loop. On the second pass, a recurrent attention layer reuses its weights but writes to a different KV cache. To size the cache, count each pass through an attention layer, even when those passes share weights.
For one token in one cache, the key and value each have four heads of 256 BF16 values. Each value takes two bytes, so storing both tensors costs 2 × 4 × 256 × 2 = 4,096 bytes.
The checkpoint has nine full-attention layers and 27 sliding-attention layers. The second recurrent pass needs another five full-attention caches and fifteen sliding-attention caches. That gives fourteen full-attention caches and 42 sliding-attention caches in total.
At 262,144 tokens, their ideal live KV storage is:
262,144 tokens × 14 full-attention caches × 4,096 bytes = 14 GiBThe 42 sliding-attention caches each retain a 1,024-token window, adding about 0.164 GiB of live data. The BF16 weights take 7.40 GiB. Together, the weights and ideal live caches occupy about 21.57 GiB. This estimate excludes allocator padding, reserved capacity, activations, and graph workspace.
The actual allocation was larger. vLLM reserved 18.49 GiB for its cache pool and reported capacity for 326,788 tokens. XPU-SMI showed 27.55 GiB in use while the server was idle. vLLM’s estimated concurrency at full context was 1.25, enough for one full-context request with some space left over. The scheduling limit of eight sequences does not mean that eight requests can all use the full context at once.
Long-context retrieval probes
The retrieval test places a numeric vault code halfway through a repeated ledger and asks for that code at the end. The server’s tokenizer provides the input length, which also agrees with the usage counters in the completion response.
| Measured input tokens | Retrieved the exact code | Finish reason |
|---|---|---|
| 4,093 | Yes | Stop |
| 32,758 | Yes | Stop |
| 131,070 | Yes | Stop |
| 262,011 | Yes | Stop |
Each answer used seven generated tokens. Even the longest prompt left room for generation below the 262,144-token limit. These four tests show that the server can use the cache at these lengths and retrieve one inserted code. They do not establish general long-context reasoning or retrieval quality.
Graph replay during decoding
The server captures graphs for batch sizes 1, 2, 4, and 8 with vLLM’s FULL_AND_PIECEWISE setting. The --cudagraph-metrics output shows which execution mode each step actually uses. Decode steps reported FULL, confirming graph replay. Large prefill chunks reported NONE because their shapes were outside the captured set.
vLLM uses CUDA names for these settings and metrics even on XPU. The runtime selected XPU on an Arc Pro B70, with FlashAttention version 2 as the attention backend. Graph replay was observed during decoding, so the graph-mode claim does not extend to every part of a request.
Part IV: Performance on one card and four replicas
Benchmark workload and request policy
AIPerf 0.12.0 sent streaming requests at a fixed concurrency. It could start another request when one finished, keeping the number in flight bounded. This is a closed-loop test: it measures performance under that client policy, but cannot predict how a queue would grow under an arbitrary production arrival rate.
The requested prompt sizes were 1,024 and 8,192 tokens. Chat formatting added tokens, so the tables report the input lengths measured by the server. Every measured request generated exactly 128 tokens, with thinking disabled, temperature zero, and random seed 42 in the load generator. The ignore_eos=true setting prevented early stopping from shortening a request. Prefix caching was off. The separate quality tests allowed normal stopping.
The client ran in a separate container without GPU access. The server kept its full 262,144-token context limit, with limits of eight sequences and 2,048 batched tokens. Each one-card run had 64 measured requests after eight warm-ups. Each four-card run had 256 measured requests after 32 warm-ups. Repeat runs covered the short prompts at one and eight nominal concurrent requests per GPU, plus the four-card 8K case at the highest concurrency. All reported percentiles exclude warm-up requests. The per-run CSV records the measurement windows and request counts.
The workstation’s desktop and a CPU-side indexing process remained running during the tests. No other inference workload ran on the test GPUs. The saved telemetry records host load and GPU memory use and frequency. The results describe performance under those conditions, rather than on an idle host or at a claimed maximum capacity.
All reported benchmark runs use a one-second idle timeout for the client’s HTTP connection pool. An earlier four-card 8K run at concurrency 32 had one failure among 256 measured requests: the connection closed after 0.94 ms, before any response arrived. The client received 255 complete measured responses. The server recorded 287 completions, including the 32 warm-ups, and no errors or aborts.
AIPerf kept idle pooled connections for 300 seconds by default, while vLLM’s server timeout was five seconds. Reusing a connection after the server had closed it was a plausible explanation, but the logs did not prove it. The full benchmark matrix, including eager mode, was repeated with the shorter client timeout. The saved evidence includes the failed attempt, but the comparison uses only complete runs. The two immediate repeats of the failing case completed all 256 requests without errors.
Single-card throughput and latency
Prepare the CPU-only client once, then run the short-prompt test at concurrency eight against the server on port 8000:
bash scripts/prepare_client.sh
python3 scripts/benchmark.py single-1024-c8-new --concurrency 8
With one short-prompt request in flight, the server produced about 41 output tokens/s. With eight in flight, it produced about 248 tokens/s across all requests. Batching improved total throughput, but each request received tokens more slowly: the median of the per-request mean ITLs rose from 23.64 to 29.50 ms.
| Actual input tokens | Total concurrent requests | Output tokens/s | TTFT p50 / p90, ms | Mean ITL p50 / p90, ms |
|---|---|---|---|---|
| 1,040 | 1 | 40.9 | 124 / 129 | 23.64 / 23.65 |
| 1,040 | 4 | 143.0 | 346 / 442 | 25.41 / 26.91 |
| 1,040 | 8 | 247.7 | 370 / 677 | 29.50 / 31.04 |
| 8,208 to 8,209 | 1 | 31.2 | 1008 / 1015 | 24.31 / 24.34 |
| 8,208 to 8,209 | 4 | 70.5 | 1802 / 1981 | 42.87 / 47.02 |
| 8,208 to 8,209 | 8 | 90.5 | 1757 / 2147 | 74.47 / 78.20 |
Each row shows the first run with the final HTTP connection policy and contains 64 measured requests. TTFT is the time to first token. For mean ITL, AIPerf first averages the gaps between tokens within each request. The table then gives the p50 and p90 of those per-request averages. The p90 is a percentile of these request averages, not of all the individual token gaps.
The 8K prompts took longer to prefill and reduced output throughput. At concurrency eight, the median per-request mean ITL reached 74.47 ms. That load would be too high for an application expecting a token roughly every 30 ms at this prompt length.
The short-prompt repeats produced 40.9 and 40.9 output tokens/s at concurrency one, and 247.7 and 247.5 at concurrency eight. These pairs show that the results repeated locally. With only two runs per setting, the reported repeat ranges should not be read as long-run confidence intervals.
Compare compiled execution with the eager fallback
For the eager comparison, the server was restarted on the same physical card with --enforce-eager. The model, --gpu-memory-utilization 0.90, input length, output length, and concurrency were unchanged. Two runs of 64 requests at concurrency eight produced 99.5 and 99.4 output tokens/s. The corresponding compiled graph runs produced 247.7 and 247.5 tokens/s. Comparing the means of the two pairs gives about 2.49 times the throughput.
The --enforce-eager flag disables both compilation and graph capture. The 2.49-times result measures their combined effect. Measuring the contribution of graph replay alone would require a compiled run with graphs disabled.
Median time to complete a request fell from about 10.29 seconds in eager mode to 4.12 seconds with compilation and graphs. The figure plots the individual request latencies: 128 measured requests across the two runs for each configuration.
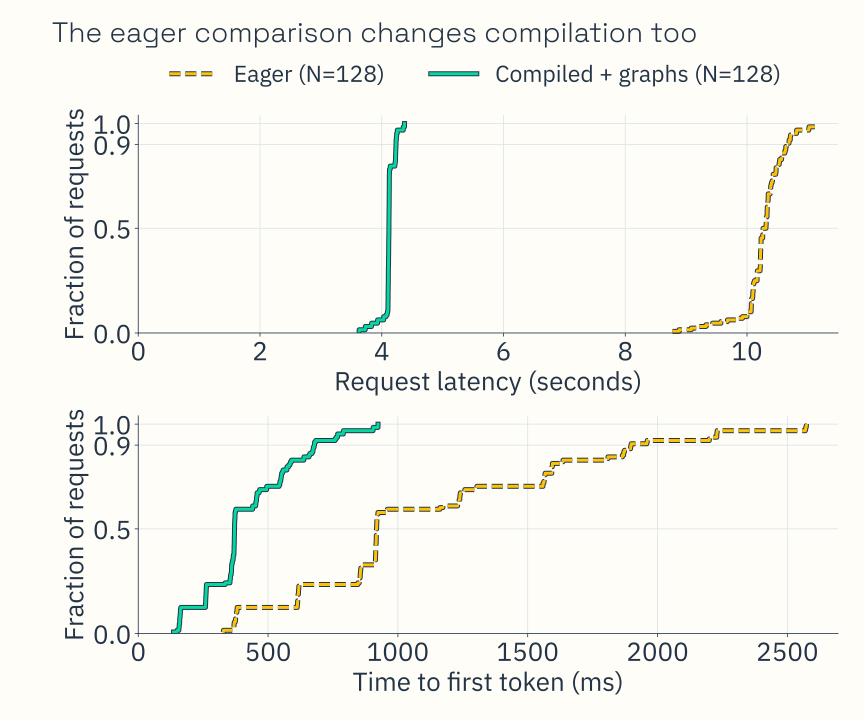
The first eager run had a p90 TTFT of 1,894 ms, compared with 677 ms in the first compiled graph run. Faster delivery of the first token and faster decoding after it both contributed to the shorter request latency.
Four independent replicas
The pinned model code rejects tensor parallelism above one, so the four cards each run a complete copy of the model. Each replica has its own weights, KV pool, and HTTP endpoint. A request stays on one card and uses that card’s cache.
After stopping the single-card server, start all four replicas:
docker stop dory-xpu
docker rm dory-xpu
bash scripts/replicas.sh start
python3 scripts/wait_ready.py --ports 8000,8001,8002,8003
python3 scripts/benchmark.py four-1024-c32-new \
  --ports 8000,8001,8002,8003 --concurrency 32 --requests 256 --warmup 32
The benchmark client sends requests to the four URLs in round-robin order. A run passes validation only when the client output and server counters confirm that every replica completed its share of measured and warm-up requests. Reported concurrency is the total number of requests in flight across all cards. Dividing by four gives a nominal per-GPU load, but individual cards can briefly have different loads as requests finish. A serving application must choose an endpoint itself or use a load balancer.
| Actual input tokens | Total concurrent requests | Output tokens/s | TTFT p50 / p90, ms | Mean ITL p50 / p90, ms |
|---|---|---|---|---|
| 1,040 | 4 | 159.8 | 125 / 143 | 23.64 / 24.44 |
| 1,040 | 16 | 558.4 | 164 / 264 | 26.72 / 28.24 |
| 1,040 | 32 | 960.8 | 352 / 763 | 29.66 / 31.30 |
| 8,208 to 8,209 | 4 | 121.4 | 1010 / 1055 | 24.33 / 25.13 |
| 8,208 to 8,209 | 16 | 273.3 | 1099 / 1741 | 48.22 / 51.75 |
| 8,208 to 8,209 | 32 | 348.0 | 1746 / 3677 | 74.57 / 79.93 |
Each row shows the first run with the final HTTP connection policy, using 256 measured requests and excluding 32 warm-ups. The repeated 1K runs at total concurrency 32 produced 960.8 and 961.2 output tokens/s. Their mean was 3.88 times the single-card mean at concurrency eight. The four-card setup has four times as many requests in flight, so the nominal load per GPU is the same. The two 8K runs at total concurrency 32 produced 348.0 and 347.6 output tokens/s.
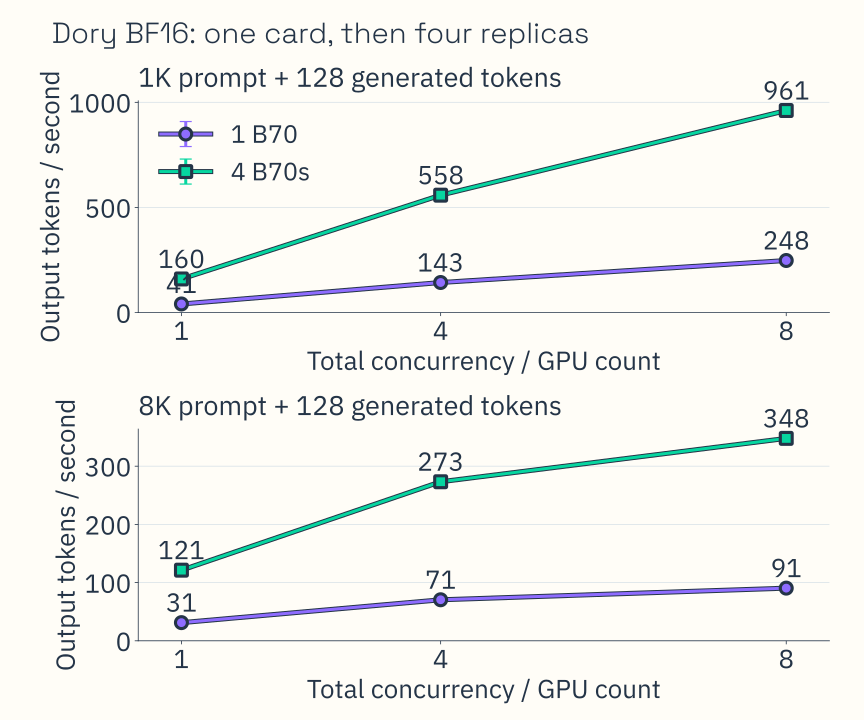
The final benchmark set contains 19 completed runs, 2,944 measured requests, and 368 warm-up requests, with no request errors. The per-run CSV records counts, durations, throughput, and latency percentiles. The per-request CSV contains the observations plotted in the latency curves. The reproduction bundle includes the audit and the excluded transport failure.
Part V: Answer-quality diagnostics
Compare eager and graph answers on the same task slices
The quality tests used lm-evaluation-harness 0.4.12 on the first 100 examples of gsm8k_cot_zeroshot version 3 and ifeval version 4. These small subsets were tested zero-shot, with seed 42, greedy decoding, thinking disabled, and a 2,048-token generation limit. Normal stopping was enabled. Matching document and prompt hashes confirmed that the eager and compiled graph runs received the same inputs. IFEval checks 163 individual instructions across its 100 prompts. A prompt passes the strict metric only if every instruction in it passes.
| Metric | Compiled + graphs | Eager |
|---|---|---|
| GSM8K flexible numeric exact match | 80 / 100 | 80 / 100 |
| GSM8K strict extraction exact match | 0 / 100 | 0 / 100 |
| IFEval prompt-level strict accuracy | 72 / 100 | 69 / 100 |
| IFEval individual instructions passed, strict | 130 / 163 | 127 / 163 |
| Requests reaching the generation limit, both tasks | 6 / 200 | 13 / 200 |
GSM8K’s flexible filter extracts the numeric answer. Its strict filter requires the number to follow the words The answer is. The prompt asks for step-by-step reasoning but does not require that phrase, so a correct number can fail strict extraction. The zero strict score reflects this mismatch. Both scores are shown, with flexible numeric exact match used to assess the arithmetic answers.
The two modes reached the same GSM8K score on different answers. Three examples passed only with compiled graphs, and three passed only in eager mode. The response text was identical for 38 of the 100 GSM8K examples and 22 of the 100 IFEval examples. The small IFEval score difference is not enough to establish that graphs improve answer quality.
All 200 requests completed in each configuration. The graph run had 194 normal stops and six stops at the token limit. Eager mode had 187 normal stops and thirteen stops at the limit. The eager harness saved complete results, but its outer shell wrapper then failed with a quoting error after the script was edited during execution. The saved samples and server completion counters independently confirmed that the requests had completed. The result records include the wrapper error.
Default reasoning with a larger token allowance
With default reasoning enabled as shown in the model card, the output allowance increased to 8,192 tokens. The test used the same 100 documents per task, served by four replicas at total concurrency 32. In the first run, the task’s text-stop setting cut off many responses before they reached a final answer.
The GSM8K task sets Q: as a stop string. Dory sometimes repeats the question in its reasoning, so encountering Q: caused the server to stop before producing the final answer. This happened in 74 responses, each with stop_reason="Q:" and an empty final answer. That run remains in the saved evidence. Repeating the evaluation with until=[] removed the text stop while retaining native end-of-sequence stopping. IFEval already had an empty text-stop list.
With that text stop removed, the completed evaluations produced:
| Metric | Default reasoning, compiled + graphs |
|---|---|
| GSM8K flexible numeric exact match | 83 / 100 |
| IFEval prompt-level strict accuracy | 83 / 100 |
| IFEval individual instructions passed, strict | 133 / 163 |
| Requests reaching the generation limit, both tasks | 14 / 200 |
All 200 requests completed: 186 stopped normally and 14 reached the token limit. None stopped on a text-stop string. On 13 requests, the server returned a null final answer, which counted as an empty answer for scoring.
The proxy saved the complete server response before converting a null final answer to an empty string for scoring. It did not substitute reasoning text for a missing answer. This run changed the token allowance, text-stop policy, and serving concurrency as well as enabling thinking. Because these settings changed together, the score differences cannot be attributed to thinking alone. These greedy evaluations on 100-example subsets also use a different setup from NVIDIA’s published benchmarks.
One B70 served the BF16 checkpoint at full context, and four independent replicas increased throughput on the tested workloads. Choosing settings for an application still requires testing its own questions and deciding how much output to allow, whether to enable thinking, and how many requests arrive over time. Those tests also need to measure tail latency. Fixed-length benchmarks and retrieval of one inserted code do not answer those application-specific questions.